
Overview
★★★★★
Overall Morningstar RatingTM
Based on risk adjusted returns among 12 funds in the Equity Digital Assets category (as of 6/30/26).
Why invest in BLOK ETF?
- Embrace the Future of Finance: The blockchain and crypto transformation is here, and BLOK is designed to help capture opportunities in this rapidly evolving market.
- Dynamic and Forward-Thinking: Unlike passive funds, BLOK uses active portfolio management to dynamically adjust holdings based on industry trends, regulatory changes, and emerging technologies.
- Proven Strategy Since 2018: BLOK identifies and dynamically invests in leading blockchain innovators, crypto infrastructure companies, and digital assets like bitcoin ETPs—positioning investors for long-term growth potential.
Objective & Strategy
Amplify Blockchain Technology ETF1 (BLOK) navigates the future of blockchain and crypto investing by combining portfolio manager insights, risk management, and active decision making. BLOK invests at least 80% of its net assets in the equity securities of companies actively involved in the development and utilization of blockchain technologies. Blockchain is a technology that underpins cryptocurrencies like bitcoin. It is a peer-to-peer secure digital ledger that records and verifies tangible (Real World Assets), intangible, and digital assets across a network of computers.
What is Blokchain Technology?
Blockchain is a peer-to-peer shared, distributed ledger that facilitates the process of recording transactions and tracking assets in a business network. Blockchain derives its name from the way it stores transaction data – in blocks that are linked together to form a chain. As the number of transactions grow, so does the blockchain. Blocks record and confirm the time and sequence of transactions, which are then logged into the blockchain, within a discrete network governed by rules agreed on by the network participants. Although initially associated with digital commodities, it can be used to track tangible (Real World Assets), intangible and digital assets and companies in all business sectors.
BLOK invests in companies that actively develop and use blockchain technology and does not invest directly in the technology. BLOK also includes companies partnering with or investing in others involved in blockchain technology and those that are part of various consortiums dedicated to it.
The BLOK-Chain Monthly
Staying up-to-date with the Rapidly Evolving Blockchain Technology

Key Information
Fund Details
| Ticker | BLOK |
| Launch Date | 01/17/2018 |
| Primary Exchange | NYSE Arca |
| CUSIP | 032108607 |
| Net Assets | $1,135,254,064 |
| Shares Outstanding | 18,250,000 |
| Holdings (view all holdings) | 53 |
| Total Expense Ratio i | 0.70% |
Portfolio Management
Performance & Holdings
Performance
| Cumulative (%) | Annualized (%) | |||||||||
|---|---|---|---|---|---|---|---|---|---|---|
| 1MO | 3MO | 6MO | YTD | Since Inception | 1YR | 3YR | 5YR | 10YR | Since Inception | |
| NAV | -7.61% | 26.37% | 10.35% | 10.35% | 307.85% | 11.06% | 44.05% | 10.23% | — | 18.09% |
| Closing Price | -7.73% | 25.90% | 10.23% | 10.23% | 307.49% | 10.59% | 43.85% | 10.18% | — | 18.08% |
The performance data quoted represents past performance and does not guarantee future results. Investment return and principal value of an investment will fluctuate so that an investor’s shares, when sold or redeemed, may be worth more or less than the original cost. Current performance may be lower or higher than the performance quoted. Brokerage commissions will reduce returns. NAV is the sum of all its assets less any liabilities, divided by the number of shares outstanding. The closing price is the last price at which the fund traded.
Top 10 Holdings
| Name | Ticker | Market Value (%) | CUSIP | Shares | Market Value ($) |
|---|---|---|---|---|---|
| Cipher Digital Inc | CIFR | 4.97% | 17253J106 | 2,185,032 | $56,417,526 |
| HUT 8 CORP | HUT | 4.00% | 44812J104 | 385,574 | $45,370,493 |
| Robinhood Markets Inc | HOOD | 3.86% | 770700102 | 431,654 | $43,847,413 |
| Figure Technology Solutions Inc | FIGR | 3.82% | 349381103 | 1,483,201 | $43,368,797 |
| Galaxy Digital Inc | GLXY | 3.82% | 36317J209 | 1,781,027 | $43,314,577 |
| Terawulf Inc | WULF | 3.73% | 88080T104 | 2,111,874 | $42,343,074 |
| Dell Technologies Inc | DELL | 3.38% | 24703L202 | 87,309 | $38,358,336 |
| Core Scientific Inc | CORZ | 3.32% | 21874A106 | 1,574,439 | $37,723,558 |
| Advanced Micro Devices Inc | AMD | 3.30% | 007903107 | 69,498 | $37,507,376 |
| Opera Ltd | OPRA | 3.19% | 68373M107 | 2,006,043 | $36,249,197 |
Fund holdings are subject to change at any time and should not be considered recommendations to buy or sell any security.
Allocation
| Industry Allocation | Weight (%) |
|---|---|
| Software | 26.88% |
| Capital Markets | 25.02% |
| Semiconductors & Semiconductor Equipment | 10.50% |
| IT Services | 6.87% |
| Banks | 6.53% |
| Financial Services | 5.87% |
| Technology Hardware Storage & Peripherals | 4.41% |
| Specialty Retail | 4.06% |
| Consumer Finance | 3.84% |
| Other | 6.02% |
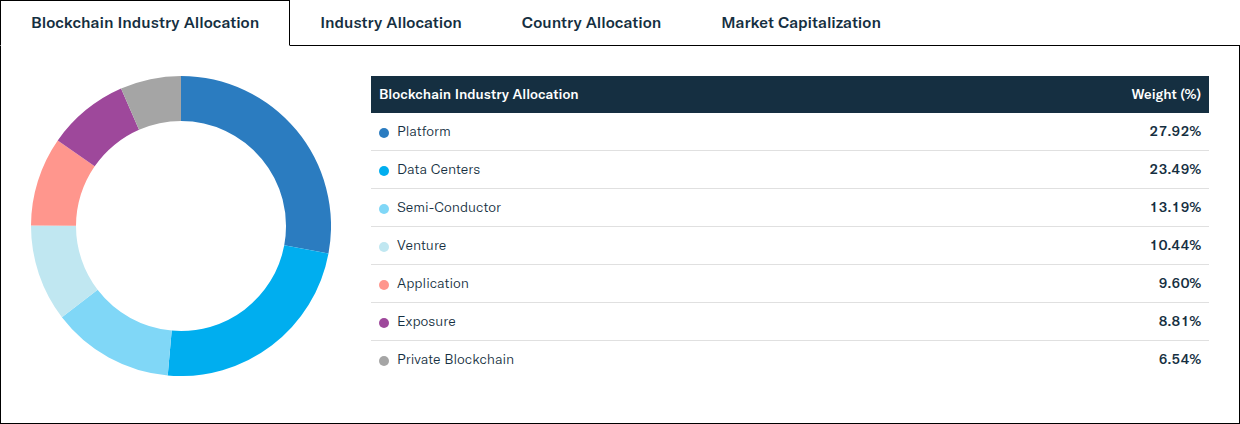
| Blockchain Industry Allocation | Weight (%) |
|---|---|
| Platform | 27.92% |
| Data Centers | 23.49% |
| Semi-Conductor | 13.19% |
| Venture | 10.44% |
| Application | 9.60% |
| Exposure | 8.81% |
| Private Blockchain | 6.54% |
| Market Capitalization | Weight (%) |
|---|---|
| Large Capitalization (> $10B) | 64.45% |
| Mid Capitalization ($2B - $10B) | 22.25% |
| Small Capitalization ($300M - < $2B) | 13.30% |
| Country Allocation | Weight (%) |
|---|---|
| United States | 81.21% |
| Norway | 3.57% |
| Japan | 3.54% |
| Brazil | 2.68% |
| Israel | 2.23% |
| Taiwan | 2.02% |
| Uruguay | 1.57% |
| Singapore | 1.44% |
| Australia | 0.89% |
| Canada | 0.87% |
- Application: Focused on building apps as platforms for blockchain and crypto ecosystems
- Conglomerate: Own and operate multiple different crypto-related businesses under one umbrella
- Data Centers: IT infrastructure supporting blockchain validation & AI computing workloads
- Exposure: Spot Crypto ETPs and select Digital Asset Treasury companies (DATS)
- Platform: Blockchain-based digital platforms for payments, transactions, or funding of accounts
- Private Blockchain: Digital ledger only accessible to select group (aka permissioned blockchain)
- Semi-Conductor: Computing hardware for crypto mining and blockchain transactions
- Venture: Provides private equity financing for blockchain and cryptocurrency projects
Distributions
| Ex-Date | Record Date | Payable Date | Amount (USD) |
|---|---|---|---|
| 06/29/2026 | 06/29/2026 | 06/30/2026 | $0.07985 |
| 12/30/2026 | 12/30/2026 | 12/31/2026 | — |
There is no guarantee that distributions will be made.
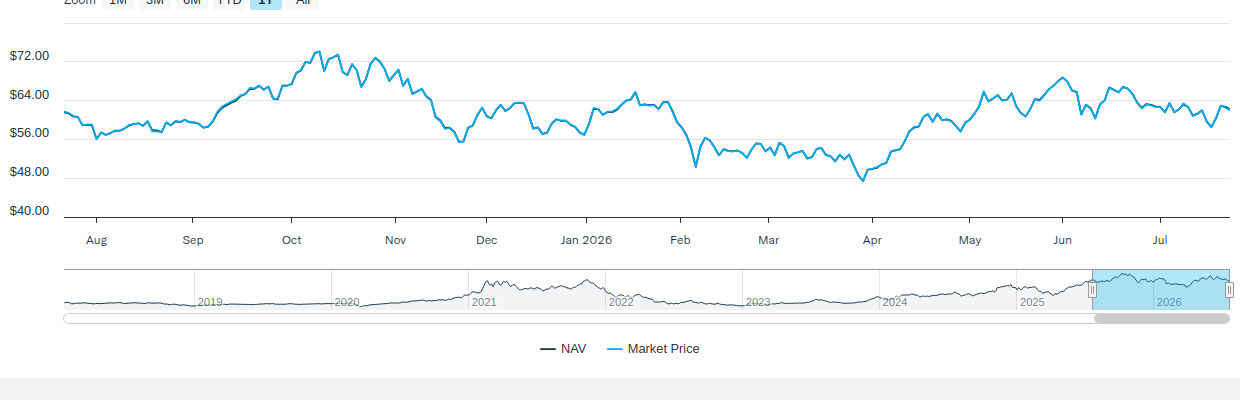
Price
NAV/Market Price
| Previous Day's NAV | |
|---|---|
| Net Asset Value: | $62.21 |
| Daily Change: | $-0.53 |
| % Daily Change: | -0.84% |
| 30-Day Median Bid/Ask Spread: | 0.18% |
| Previous Day's Market Price | |
|---|---|
| Closing Price: | $62.04 |
| Daily Change: | $-0.50 |
| % Daily Change: | -0.80% |
| % Premium/Discount: | -0.27% |
Daily Price/NAV Performance
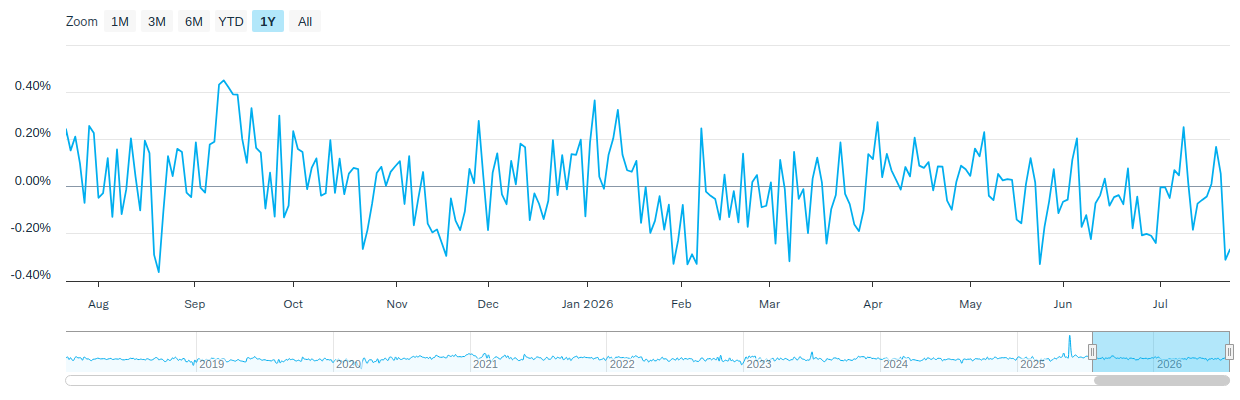
Premium/Discount
| 2025 | Q1 2026 | Q2 2026 | Q3 2026 | Q4 2026 | |
|---|---|---|---|---|---|
| Days Traded at Premium | 159 | 23 | 33 | - | - |
| Days Traded at NAV | 0 | 0 | 0 | - | - |
| Days Traded at Discount | 92 | 38 | 29 | - | - |
The table and line graph are provided to show the frequency at which the closing price of the Fund was at a premium (above) or discount (below) to the Fund’s daily net asset value (“NAV”). The table and line graph represent past performance and cannot be used to predict future results. Shareholders may pay more than NAV when buying Fund shares and receive less than an NAV when those shares are sold because shares are bought and sold at current market prices.
Literature
Fund Resources
Insights
BLOK-Chain Monthly July 2026
July 15, 2026
Blockchain Is Charging Forward With Or Without Clarity.
BLOK-Chain Monthly June 2026
June 9, 2026
Getting Hyper About Tokenization
BLOK-Chain Monthly May 2026
May 14, 2026
After 100 Months, We Have "Clarity"
How to Invest
Amplify ETFs trade throughout the day, similar to publicly-traded stocks, on an exchange. There are multiple ways to invest in Amplify ETFs:
- Contact a Financial Advisor to discover how Amplify ETFs may fit within your portfolio.
- Amplify ETFs are available through various online platforms and brokerage accounts.
Connect with your ETF Specialist or call (855) 267-3837
1Amplify Transformational Data Sharing ETF renamed on/about 10/13/25.
Investing involves risk, including the possible loss of principal. Shares of any ETF are bought and sold at closing price (not NAV), may trade at a discount or premium to NAV and are not individually redeemed from the Fund. The Fund is subject to active management risk. Narrowly focused investments, like those in blockchain, are typically more volatile and riskier than broadly diversified portfolios.
Blockchain technology may not develop efficient processes that yield economic returns for the Fund’s investments, with risks including theft, competition, cybersecurity issues, developmental challenges, and lack of regulation. The investable universe may include companies involved in transformational data sharing or blockchain consortia. The Fund will invest in foreign securities, which carry additional risks compared to U.S. securities.
The Fund may have indirect exposure to cryptocurrencies, such as bitcoin, through investment funds, but does not invest directly in bitcoin. Cryptocurrency investments are highly speculative, subject to extreme volatility, and may produce uncertain U.S. federal income tax treatment.
©2026 Morningstar, Inc. All rights reserved. The information contained herein: (1) is proprietary to Morningstar and/or its content providers; (2) may not be copied or distributed; and (3) is not warranted to be accurate, complete, or timely. Neither Morningstar nor its content providers are responsible for any damages or losses arising from any use of this information. Past performance is no guarantee of future results.
The Morningstar Rating™ for funds, or “star rating”, is calculated for managed products (including mutual funds, variable annuity and variable life subaccounts, exchange-traded funds, closed-end funds, and separate accounts) with at least a three-year history. Exchange-traded funds and open-ended mutual funds are considered a single population for comparative purposes. It is calculated based on a Morningstar Risk-Adjusted Return measure that accounts for variation in a managed product’s monthly excess performance, placing more emphasis on downward variations and rewarding consistent performance. The Morningstar Rating does not include any adjustment for sales loads. The top 10% of products in each product category receive 5 stars, the next 22.5% receive 4 stars, the next 35% receive 3 stars, the next 22.5% receive 2 stars, and the bottom 10% receive 1 star. The Overall Morningstar Rating for a managed product is derived from a weighted average of the performance figures associated with its three-, five-, and 10-year (if applicable) Morningstar Rating metrics. The weights are: 100% three-year rating for 36-59 months of total returns, 60% five-year rating/40% three-year rating for 60-119 months of total returns, and 50% 10-year rating/30% five-year rating/20% three-year rating for 120 or more months of total returns. While the 10-year overall star rating formula seems to give the most weight to the 10-year period, the most recent three-year period actually has the greatest impact because it is included in all three rating periods. BLOK received 5 stars among 12 funds in the Equity Digital Assets category for the overall and 3-year periods ending 6/30/26.
ETF Express Award Methodologies: https://etfexpress.com/issuer-methodology/
Investment Adviser: Amplify Investments LLC; Sub-Adviser: Tidal Investments, LLC.